My Biological Age Is 25. I’m 38. Here’s What My Bloodwork Revealed.
Disclosure: This post contains affiliate links. I only recommend products I've personally vetted and use myself.
Feeling great and performing my best — mentally and physically — is a non-negotiable for me. And I've learned that having the right health data is one of the most powerful tools for actually doing that. Not just in a general "know your numbers" way, but specifically: data tells you which supplements you actually need, and which ones you're wasting money on without knowing it.
I've worn wearable health trackers for over 15 years — tracking sleep, HRV, and recovery. So when I started looking into more comprehensive bloodwork last year, it wasn't because something felt off. It was because I wanted a real picture of what was actually happening inside my body — and most standard bloodwork isn't built to give you that.
Here's something most people don't know: standard reference ranges aren't based on what's optimal. They're based on the average of a tested population — which in the U.S. means a largely unhealthy one. If 60%+ of Americans are metabolically compromised, being "in range" doesn't mean you're optimized. It means you're average. And average isn't what I'm after.
After researching my options and thoroughly vetting Vitality Blueprint, I was impressed enough that I now recommend it to clients who are serious about elevating their mental and physical performance. Then I got my own full analysis done.
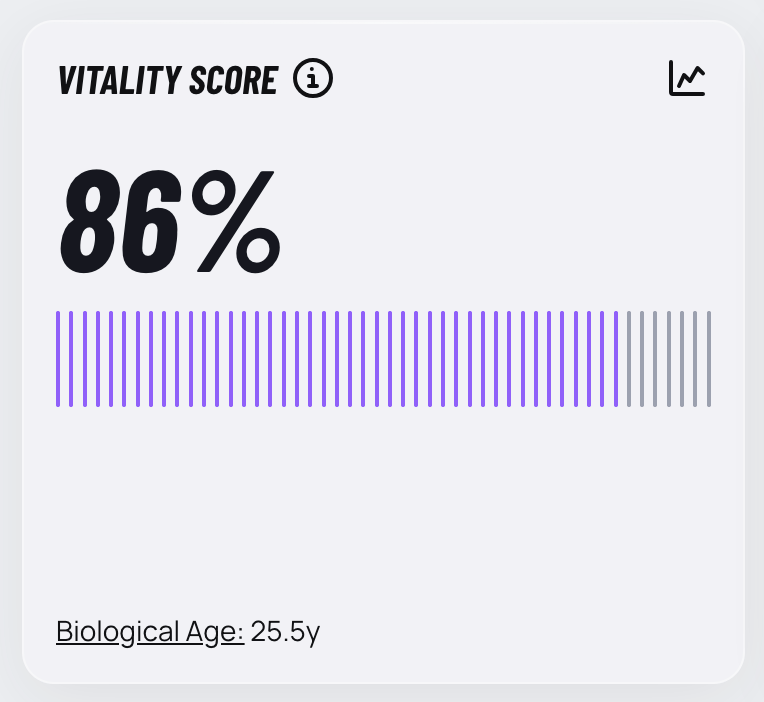
My biological age came back as 25.5 years. I'm 38.
My Vitality Score — an overall readiness metric calculated across 10 functional areas of your physiology, from hormone profile and brain chemistry to inflammation, gut health, and cardiovascular function — came in at 86%.
Vitality Scores range from:
Severe (0–49%)
Needs Improvement (50–69%)
Sufficient (70–89%)
Excellent (90–100%).
At 86%, I'm in the Sufficient range and close to the Excellent threshold.
But here's the thing: the score tells you where you are. The individual biomarker analysis tells you why — and more importantly, what to do about it. Even at 86%, I had 8 markers out of range and 33 more that were normal but not optimized for performance. The overall score wouldn't have surfaced any of that.
I want to be clear — my score and biological age didn't happen by accident. I've spent years putting in the work: prioritizing sleep, dialing in my nutrition, and being intentional about supplementation. [Read more: Huberman Lab’s Top 3 Recommended Supplements.] The data reflects all of that. But even with an 86% Vitality Score, the analysis still flagged areas where I wasn't operating at my peak. That's the point — and honestly, that's the part I found most useful.
👉 Be sure to use code LOMYRICK at checkout for 10% off if you sign-up!
What your doctor's bloodwork actually is (and isn't)
Most of us have had a standard blood panel at some point. And unless something came back seriously wrong, it probably didn't change much for you. That's not your doctor's fault — it's how the system is designed.
Standard bloodwork is built to detect disease, not drive performance. And those "normal ranges" on your results? They're derived from population averages — the range that captures the middle 95% of everyone tested. When the average tested population has high rates of metabolic disease, nutrient deficiency, and chronic stress, "normal" is a very low bar. You can clear it easily and still be leaving a lot on the table.
My Vitamin D is a perfect example. At 31 ng/mL, I'm technically in the "normal" range (30–100 ng/mL). Most doctors would look at that and say nothing. But the performance range? 55–80 ng/mL. I was barely above the floor of normal — and almost half the minimum for optimization. That marker alone affects resilience, hormone profile, brain chemistry, energy, and more. And my standard bloodwork would have never flagged it.
Vitality Blueprint uses performance ranges instead — built on research from world-class sports scientists including Dr. Andy Galpin and Dan Garner, who've worked with elite athletes across the UFC, NFL, NBA, and Olympics. The question isn't "are you in the normal range?" It's "are you operating at your ceiling?"
And it goes further than that: the ranges are tailored to your sex. Many biomarkers behave differently between men and women — hormones like testosterone, for example, have much lower reference ranges in women and need to be interpreted in the context of female physiology entirely. My report compares my results against female performance ranges, not a one-size-fits-all standard. That level of precision matters. You can't optimize with generic data.
That's a completely different standard. And it changes everything that shows up.
What my Vitality Bloodwork revealed


Out of 127 biomarkers analyzed:
86 came back in the performance range (a great result),
33 were in the normal range but not optimized for performance, and
8 were out of range entirely.
I'm not going to walk through all of them — but here are a few that stood out, because they're the kind of thing most people would never know to check.
What needs attention:

Vitamin D.
Mine came in at 31 ng/mL — technically "normal," but barely. The performance range is 55–80 ng/mL. My protocol now includes 2,000 IU daily through spring, summer, and fall, with an increase in winter. Vitamin D affects immune function, mood, muscle recovery, and cognitive performance. Most people are walking around sub-optimal and have no idea — because their doctor looked at the same number and said nothing.
Most experts recommend taking Vitamin D3 with K2.
👉 I take Momentous Vitamin D3 (5000 IU) with a separate K2 supplement.
👉 I’ve also taken Trace Minerals D3 + K2 in the past, so you don’t have to take 2 different supplements.

Iron.
Mine came in at 146 ug/dL — technically normal (range: 27–159 ug/dL), but above the performance range of 80–130 ug/dL. And yes, too much iron is also a thing. Elevated iron can increase oxidative stress and affect cell health and energy. This is the kind of detail that never shows up on a standard panel — because 146 is "fine." Except it isn't, for performance.
👉 I take Momentous Iron.

Zinc.
At 74 ug/dL, I'm in the normal range (50–130) but well below the performance range of 100–130. Zinc is involved in immune function, DNA synthesis, antioxidant activity, and cell health — and it's one people often assume they're fine on because they take a multivitamin. Data over assumptions.
👉 I take Momentous Zinc.
Cortisol.
Mine came in at 15.4 ug/dL — normal range, but above the performance ceiling of 14 ug/dL. Slightly elevated cortisol is one of the most common patterns in high performers. It's the biological signature of someone who's driven, always "on," and chronically running a little hot. Left unchecked, it quietly drags on resilience, hormone balance, sleep quality, and brain chemistry — all the things that matter most for sustained performance. This is exactly why I coach around nervous system regulation, not just mindset.
EPA (Omega-3).
This one was actually out of range — not too low, but too high at 3.0% (range: 0.2–2.3%). Vitality flagged it as a Key Constraint. EPA is an omega-3 fatty acid linked to brain health, inflammation regulation, and cardiovascular function — and like most things in the body, balance matters. More isn't always better. Without this analysis, I would have had no idea my fatty acid levels were off in either direction.
What's working:
Not everything came back needing attention — and that's just as important to know.
My C-Reactive Protein (CRP) came back at 0.7 mg/L — right in the performance range (0–1 mg/L). CRP is an inflammation marker. Low CRP means your body isn't in a state of chronic inflammation, which is a big deal for recovery, cardiovascular health, joint health, and longevity. This one I'm proud of.
My Calcium, Potassium, and Vitamin B12 also all came back optimal. Here's why that matters practically: I don't need a B12 supplement. If I were just guessing and taking a standard multivitamin, I'd likely be supplementing things I don't need while missing the ones I do. That's wasted money at best — and throwing off other markers at worst.
Knowing your data isn't just about finding what's missing. It's about understanding what you're already doing right so you can stop guessing and start being precise.
The analysis also gave me a full Performance Protocol: lifestyle adjustments, nutrition shifts, and supplement recommendations, all mapped to my specific goals and physiology. Not a generic checklist. A prioritized plan built around my actual numbers.
Why this matters if you're a high performer
Here's what I see all the time: driven, accomplished people doing a lot right — and still hitting a ceiling they can't explain. They assume it's a mindset issue, a discipline issue, a strategy problem.
Sometimes it is.
But sometimes it's biology. And biology doesn't care how motivated you are.
You can't out-discipline a Vitamin D deficiency. You can't meditate your way through the fatigue that comes from sub-optimal iron. And you can't make smart supplement decisions without real data — you're just guessing, and guessing gets expensive fast.
This is the Science pillar of my work. It's the piece most high performers skip — not because they don't care, but because they've never had access to this level of detail before. Standard bloodwork just doesn't give it to you.
The bottleneck isn't always in your head. Sometimes it's in your blood.
Want your own data?
I partnered with Vitality Blueprint because this is exactly the kind of root-level insight that changes how you operate — 85–129 biomarkers, interpreted through a performance lens by the same scientists behind world-champion athletes. Not a clinical report card. A performance plan built around your specific physiology.
Use code LOMYRICK at checkout for 10% off.
Frequently Asked Questions
What is Vitality Blueprint and how does it work?
Vitality Blueprint is a performance bloodwork platform built by world-class sports scientists — including Dr. Andy Galpin and Dan Garner, who've worked with elite athletes across the UFC, NFL, NBA, and Olympics. You schedule a blood draw at one of 2,000+ locations, they analyze 85–129 biomarkers using performance ranges (not clinical ones), and deliver a personalized protocol covering lifestyle, nutrition, and supplementation. It's not a clinical report card — it's a performance plan built around your specific physiology.
What's the difference between normal and performance blood work ranges?
Normal ranges are derived from population averages — specifically, the middle 95% of a tested population. In the U.S., that population includes a lot of people who are metabolically unhealthy, chronically stressed, and nutrient-deficient. So "normal" is really just "average for an unhealthy population." Performance ranges are set based on what's optimal for high-level mental and physical output — a much higher bar. You can clear the normal range on every marker and still be significantly sub-optimized.
Is Vitality Blueprint worth it?
In my experience, yes — and I don't recommend things I haven't thoroughly vetted myself. The level of detail is unlike anything you'll get from a standard panel, and the personalized protocol gives you something actionable to work with. It's the difference between knowing you're "fine" and knowing exactly what to do next. Use code LOMYRICK for 10% off your first analysis.